Monitoring
Polyclaw integrates with Azure Monitor via OpenTelemetry to provide traces, metrics, and logs for the agent runtime. Monitoring is optional and can be provisioned with one click from the dashboard.
Architecture
The telemetry pipeline flows from the agent runtime through the OpenTelemetry distro to Azure Monitor:
Agent Runtime -> OTel Distro -> Application Insights -> Log Analytics
The integration uses the azure-monitor-opentelemetry distro, which automatically instruments HTTP requests, database calls, and other common operations. Polyclaw adds custom spans for agent-specific operations (tool invocations, model calls, session lifecycle).
Setup
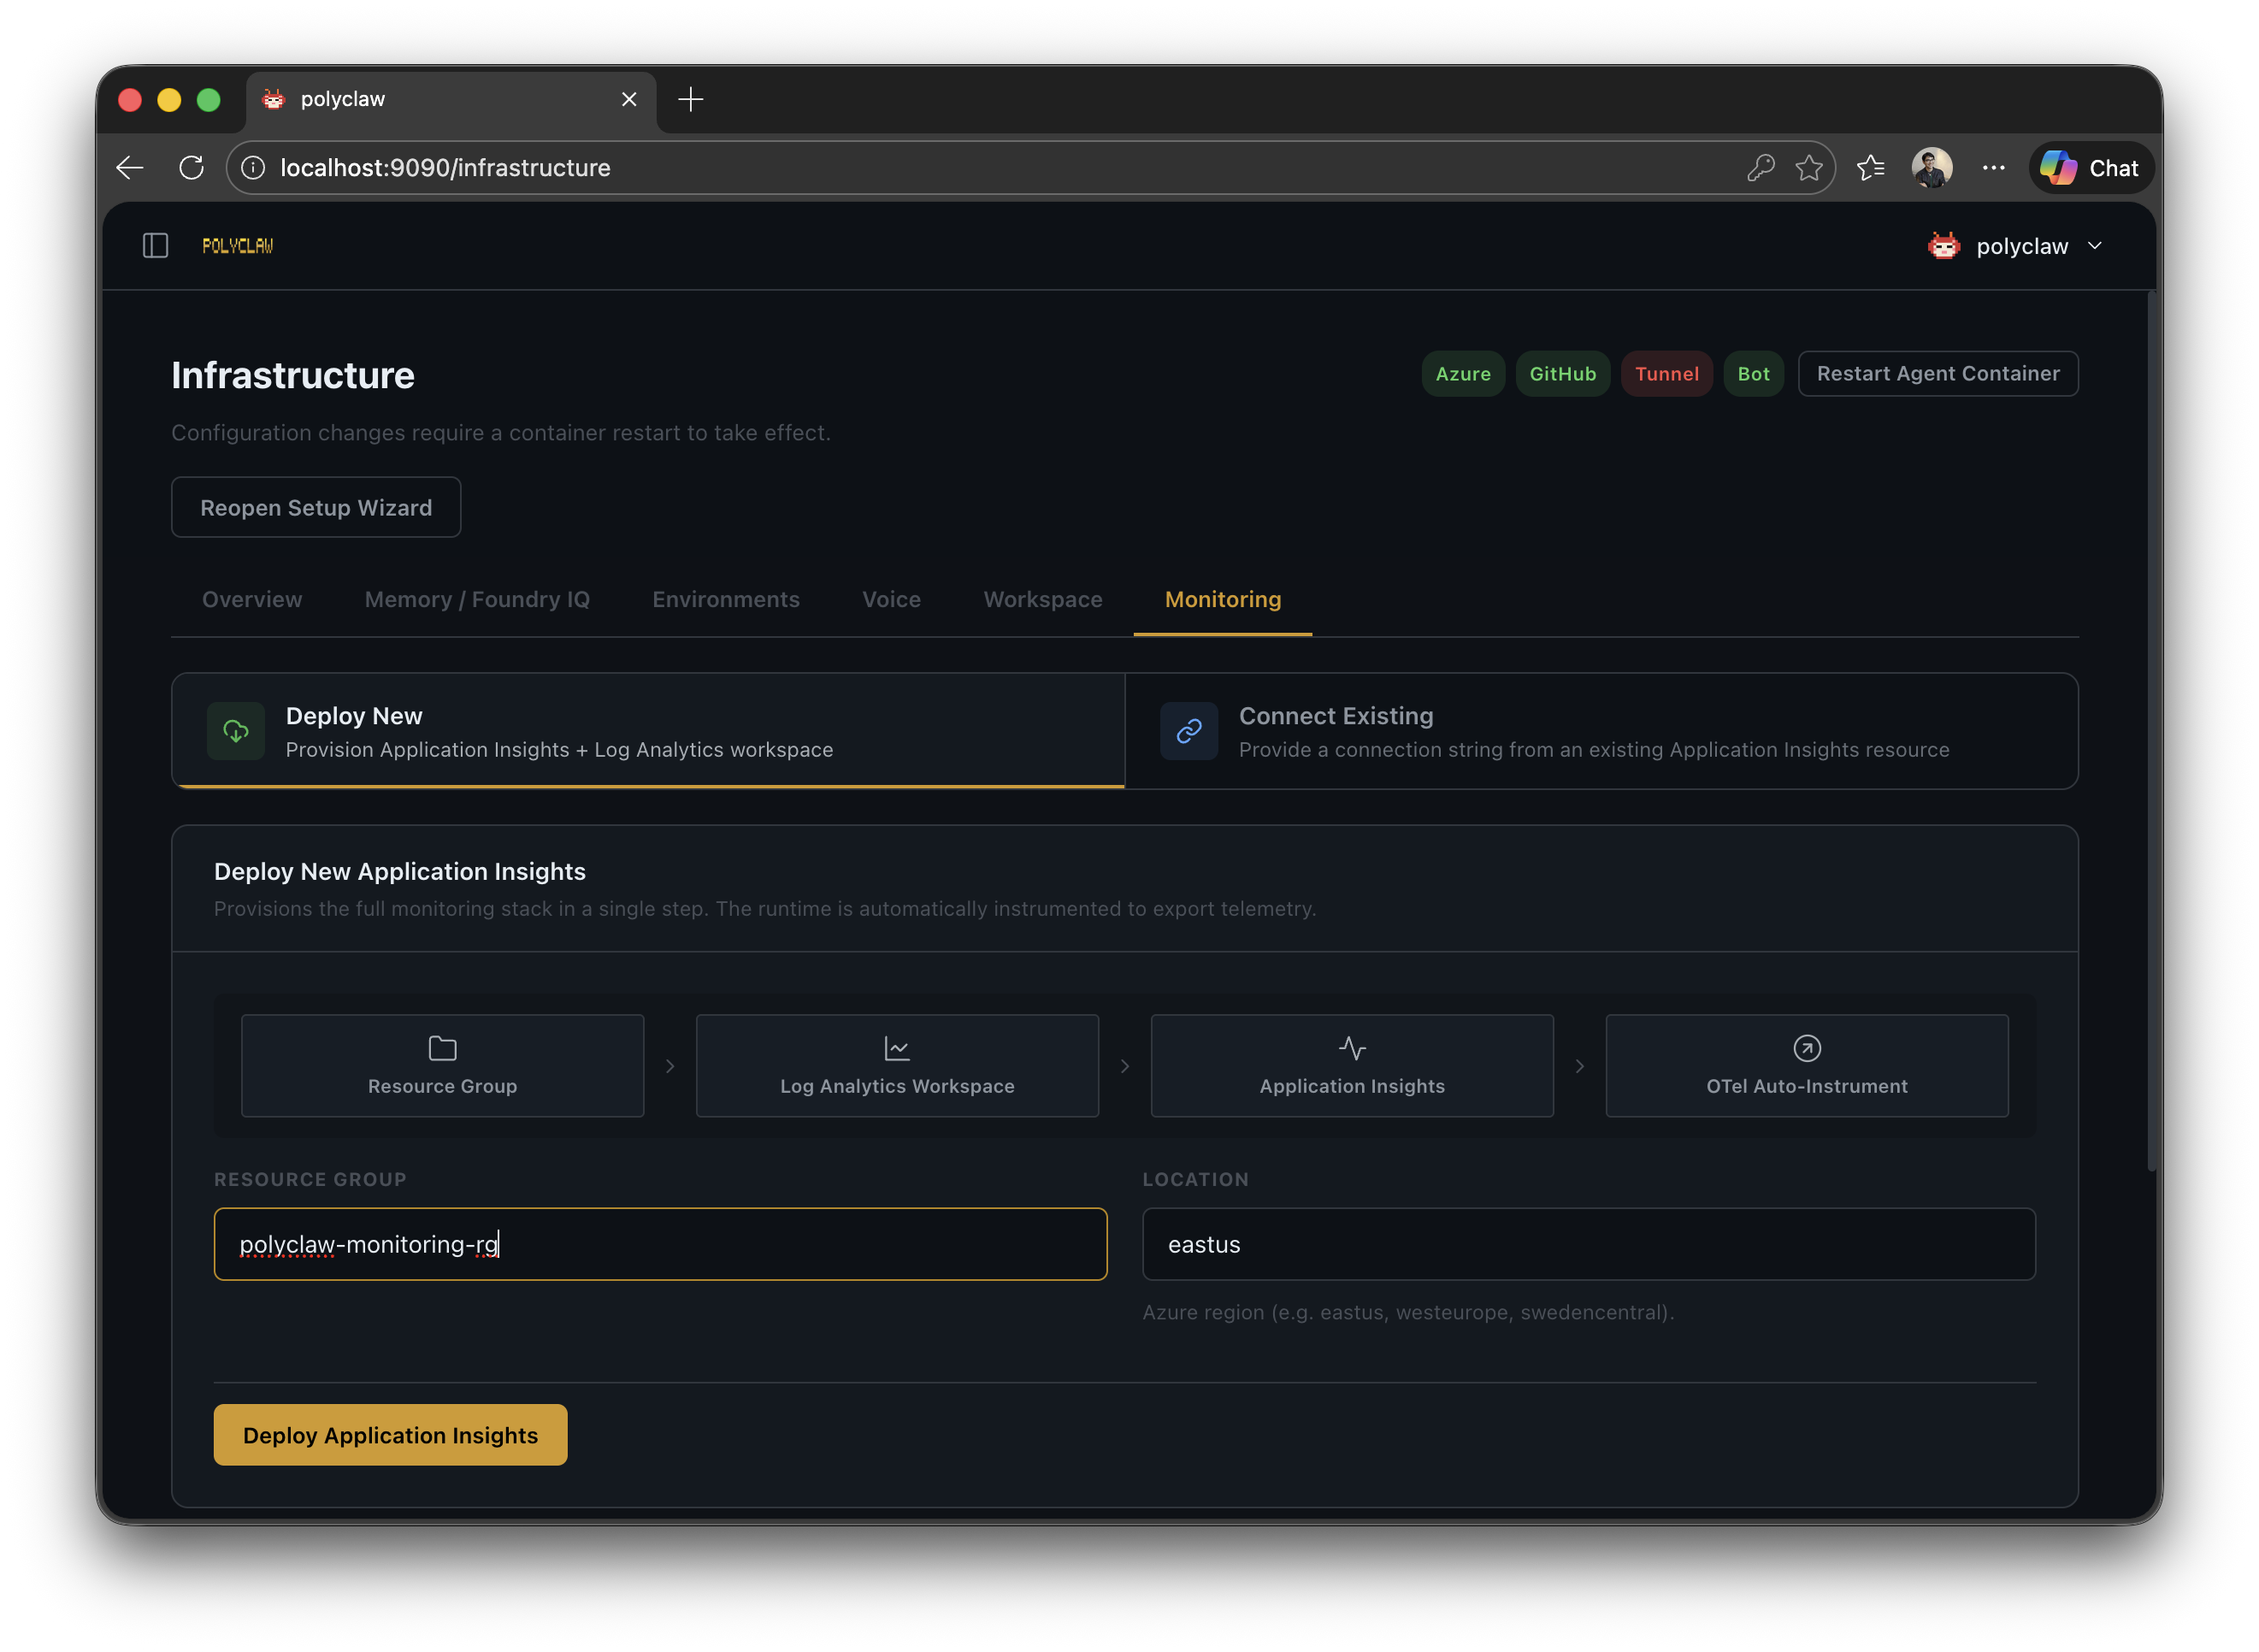
Deploy New (One-Click)
From the Infrastructure Settings page, select the Monitoring tab and choose Deploy New. This provisions:
- A Log Analytics workspace in your selected Azure region
- An Application Insights resource connected to the workspace
The connection string is automatically written to the agent configuration. No manual setup required.
Alternatively, monitoring resources can be provisioned as part of the Bicep infrastructure deployment by enabling the deploy_monitoring flag. See Bicep Infrastructure for details.
Connect Existing
If you already have an Application Insights resource, paste its connection string in the Connect Existing section. The agent validates the connection string format before saving.
Configuration
| Setting | Description | Default |
|---|---|---|
| Connection String | Application Insights connection string | – |
| Sampling Ratio | Fraction of telemetry to collect (0.0–1.0) | 1.0 (all) |
| Live Metrics | Enable real-time metrics stream | Disabled |
Sampling is useful for high-throughput deployments where collecting every trace would be cost-prohibitive. A ratio of 0.1 collects 10% of traces.
Telemetry
Traces
Custom spans wrap agent operations with semantic attributes:
| Span | Kind | Attributes |
|---|---|---|
| Agent operation | Internal | Operation name, session ID |
| Model invocation | Client (dependency) | gen_ai.system, gen_ai.request.model, agent name |
| Tool execution | Internal | Tool name, duration, status |
The tracer name is polyclaw. All spans are visible in the Application Insights Transaction Search and End-to-End Transaction view.
Metrics
Standard OpenTelemetry metrics (HTTP request duration, dependency duration, exception counts) are collected automatically by the distro. Custom agent metrics can be added via the span helper API.
Logs
Python logging output is forwarded to Azure Monitor as trace records. Each log entry carries the module name, context tags (e.g., [agent.start], [chat.dispatch]), and severity level.
Dependencies
Model calls appear as dependency spans in Application Insights, showing latency, success/failure, and the model name. This gives visibility into Copilot SDK performance.
Live Metrics
When enabled, the Live Metrics stream provides a real-time view of request rate, failure rate, and dependency duration in the Azure Portal.
Agent Framework Dashboard in Application Insights
Polyclaw emits telemetry in the format expected by the Microsoft Agent Framework. This means the built-in Agent Framework dashboard available in Application Insights works out of the box – no extra configuration or custom queries required.
The dashboard surfaces agent-level metrics such as session counts, tool invocation success rates, model call latency, and failure breakdowns, all derived from the spans and semantic attributes that Polyclaw already produces.
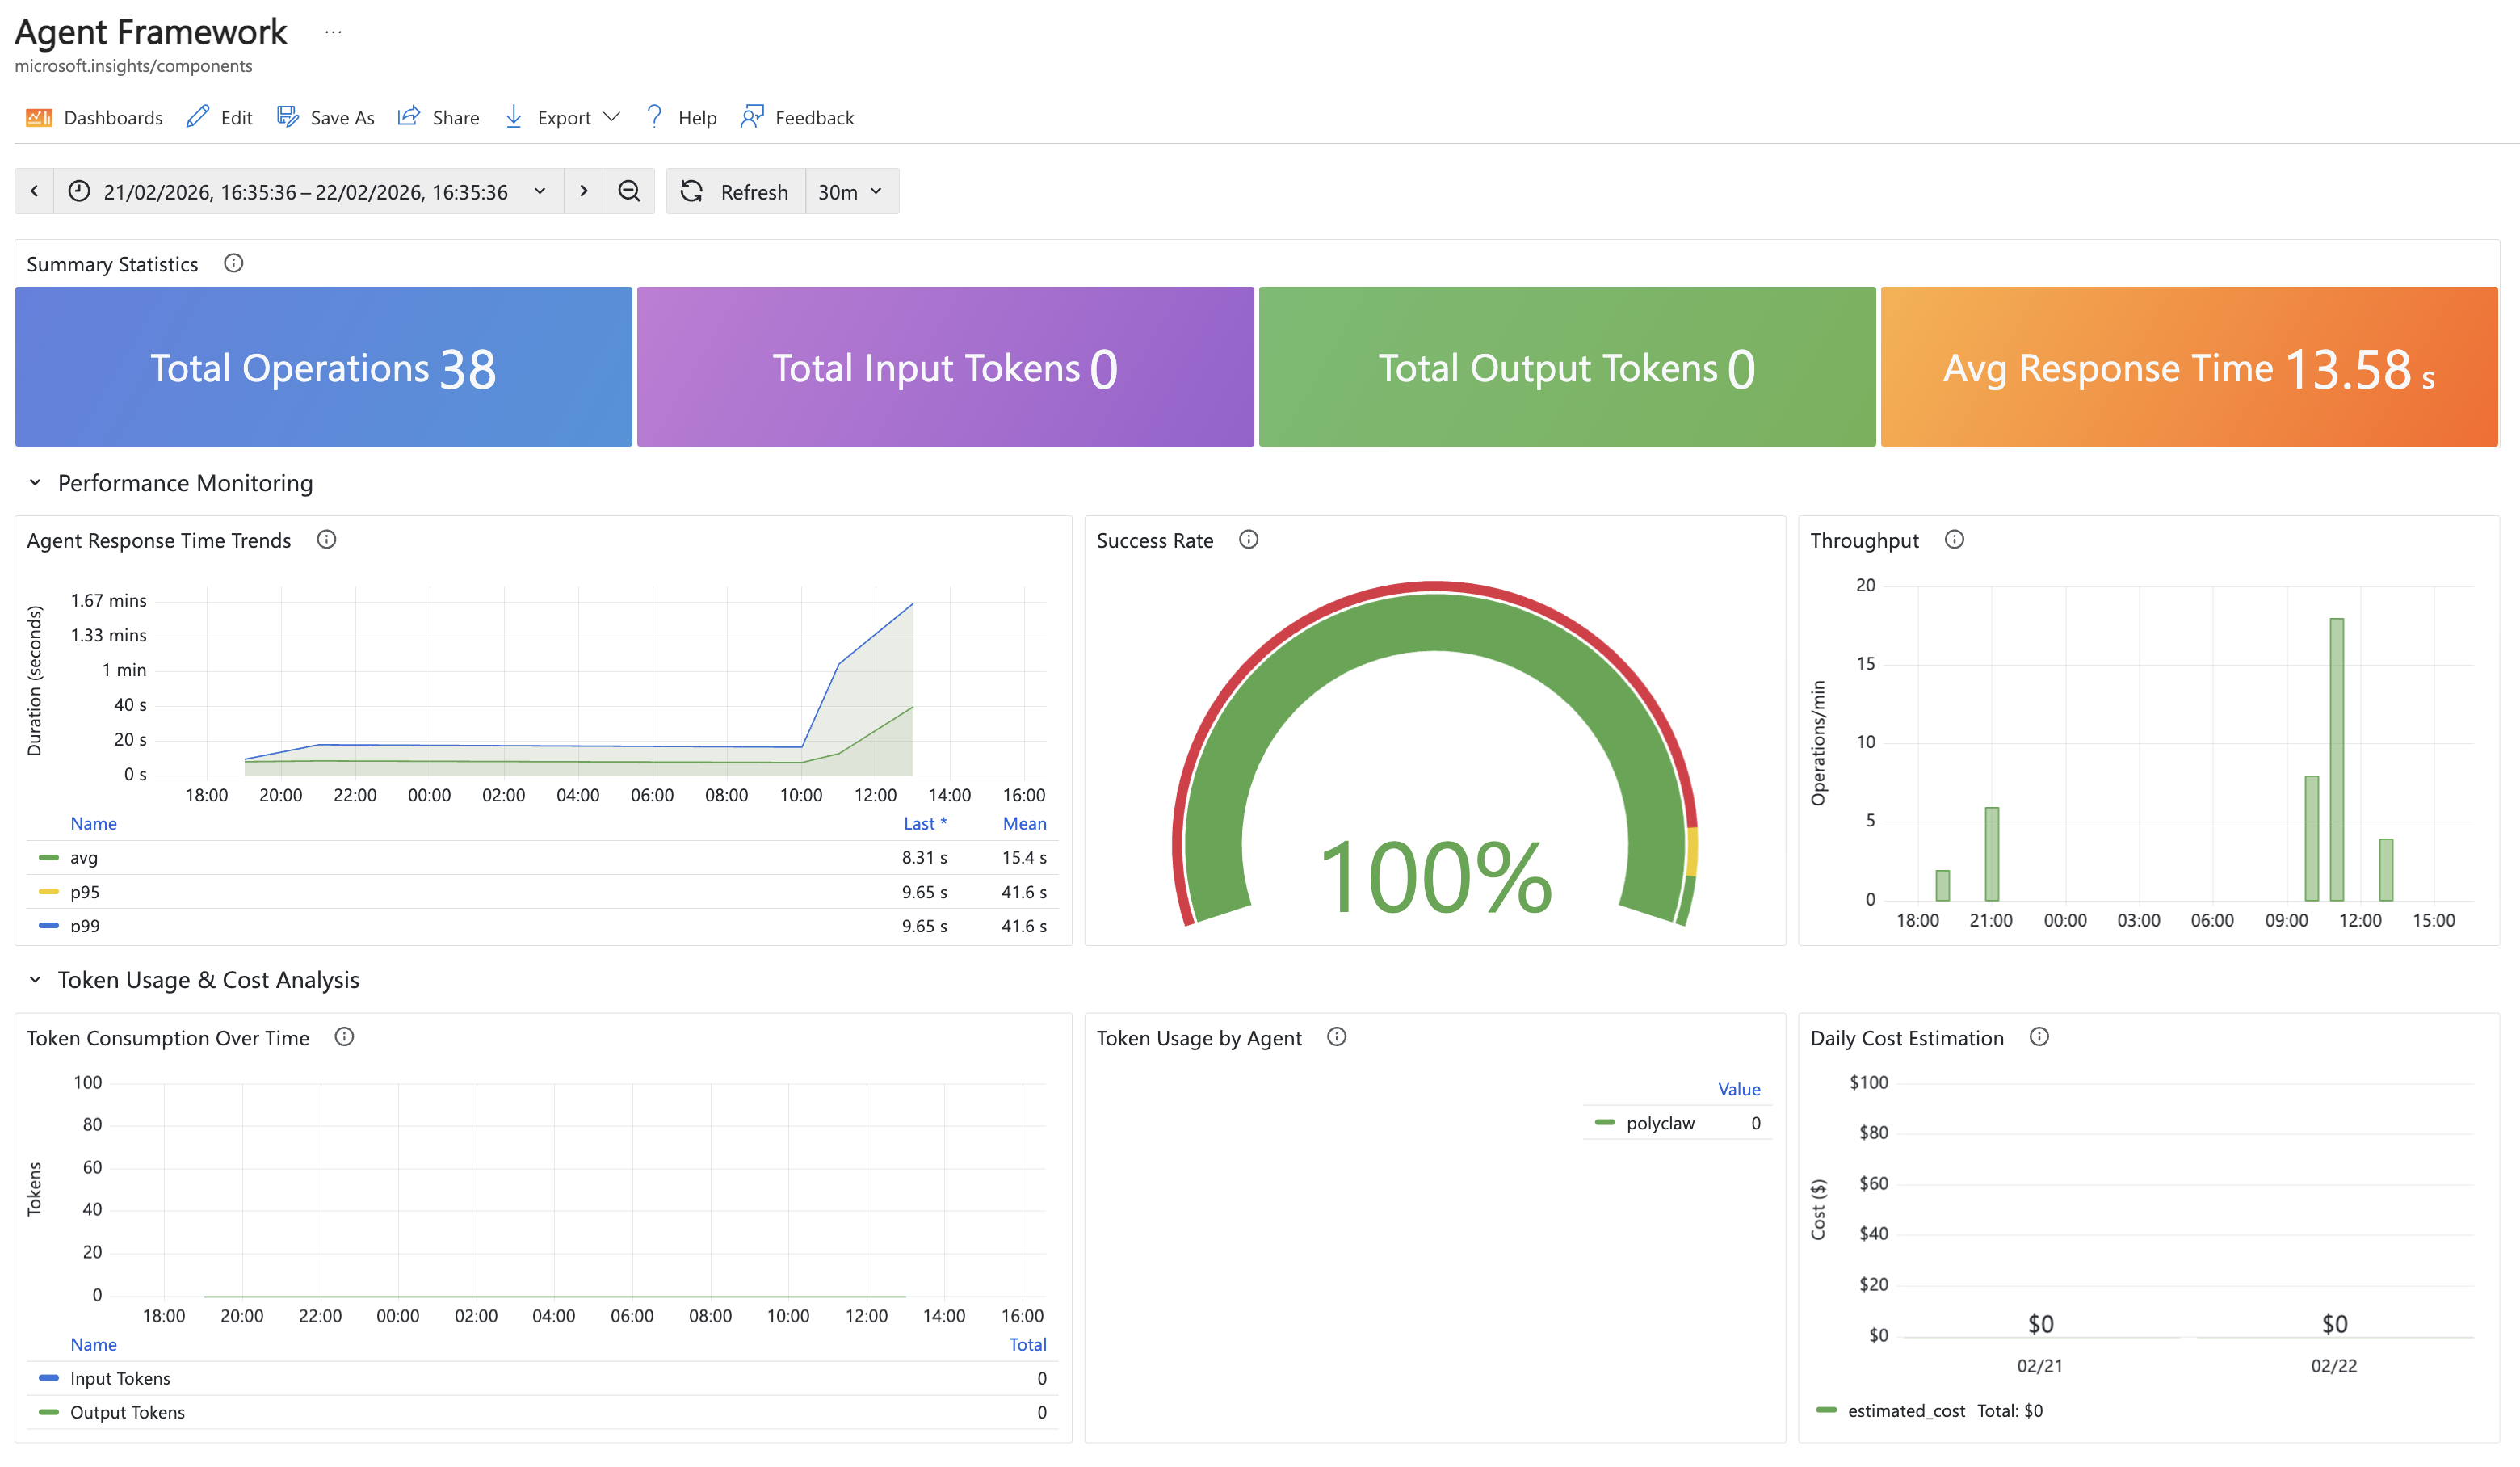
Because the telemetry follows the Agent Framework conventions (gen_ai.system, gen_ai.request.model, operation names, dependency types), the dashboard can correlate traces across the full request lifecycle – from incoming user messages through model calls and tool executions to the final response.
Dashboard Links
After provisioning, the monitoring configuration provides direct links to:
- Azure Portal – Application Insights overview, transaction search, failures, and performance views
- Agent Framework Dashboard – the built-in agent monitoring view in Application Insights, powered by the telemetry format described above
- Grafana Agent Dashboard – pre-built dashboard URL for Azure Managed Grafana (if configured)
Lifecycle
Monitoring is bootstrapped during server startup. It is designed to be non-blocking – if the connection string is missing or invalid, the agent starts normally without telemetry. The shutdown_otel() function gracefully flushes all pending telemetry during server shutdown.
Runtime status can be checked via:
GET /api/monitoring/status– returns whether telemetry is active, the connection string (masked), sampling ratio, and live metrics stateGET /api/monitoring/config– full configuration including provisioned resource metadata
Dependencies
The following packages are required (included in pyproject.toml):
azure-monitor-opentelemetry >= 1.6opentelemetry-api >= 1.20opentelemetry-sdk >= 1.20
These are installed automatically when setting up the project.