Tool Activity
Polyclaw includes an enterprise audit dashboard that logs every tool invocation with automated risk scoring, content safety results, and manual flagging. The append-only log provides full visibility into what the agent has done, when, and why.
What Gets Logged
Every tool call – whether it completes, is denied by guardrails, or errors out – is recorded with the following fields:
| Field | Description |
|---|---|
| Tool | Name of the tool invoked |
| Category | sdk (built-in), mcp (MCP server), custom, or skill |
| Arguments | Full input parameters |
| Result | Tool output (on completion) |
| Status | started, completed, denied, or error |
| Risk Score | Automated 0–100 score based on pattern matching |
| Risk Factors | List of matched suspicious patterns |
| Interaction Type | Guardrails strategy used: hitl, aitl, pitl, filter, deny, or none |
| Shield Result | Prompt Shield outcome: clean, attack, error, or not_configured |
| Shield Detail | Content analysis detail from Prompt Shields |
| Duration | Execution time in milliseconds |
| Session | Which chat session the call belongs to |
| Flagged | Whether the entry has been manually flagged for review |
Automated Risk Scoring
Every tool invocation is automatically scored for risk. The scoring system evaluates tool arguments and results against known suspicious patterns and assigns a severity level (low, medium, high, critical). Risk scoring is fully automated and runs on every tool call regardless of guardrails configuration. It is an observability layer, not an enforcement layer – it does not block tool calls on its own.
Category Inference
Tools are automatically categorized based on naming conventions:
- sdk: matches built-in tool names (
create,edit,view,grep,glob,run,bash) - mcp: name contains
__or., or starts withmcp_ - custom: everything else
Dashboard Features
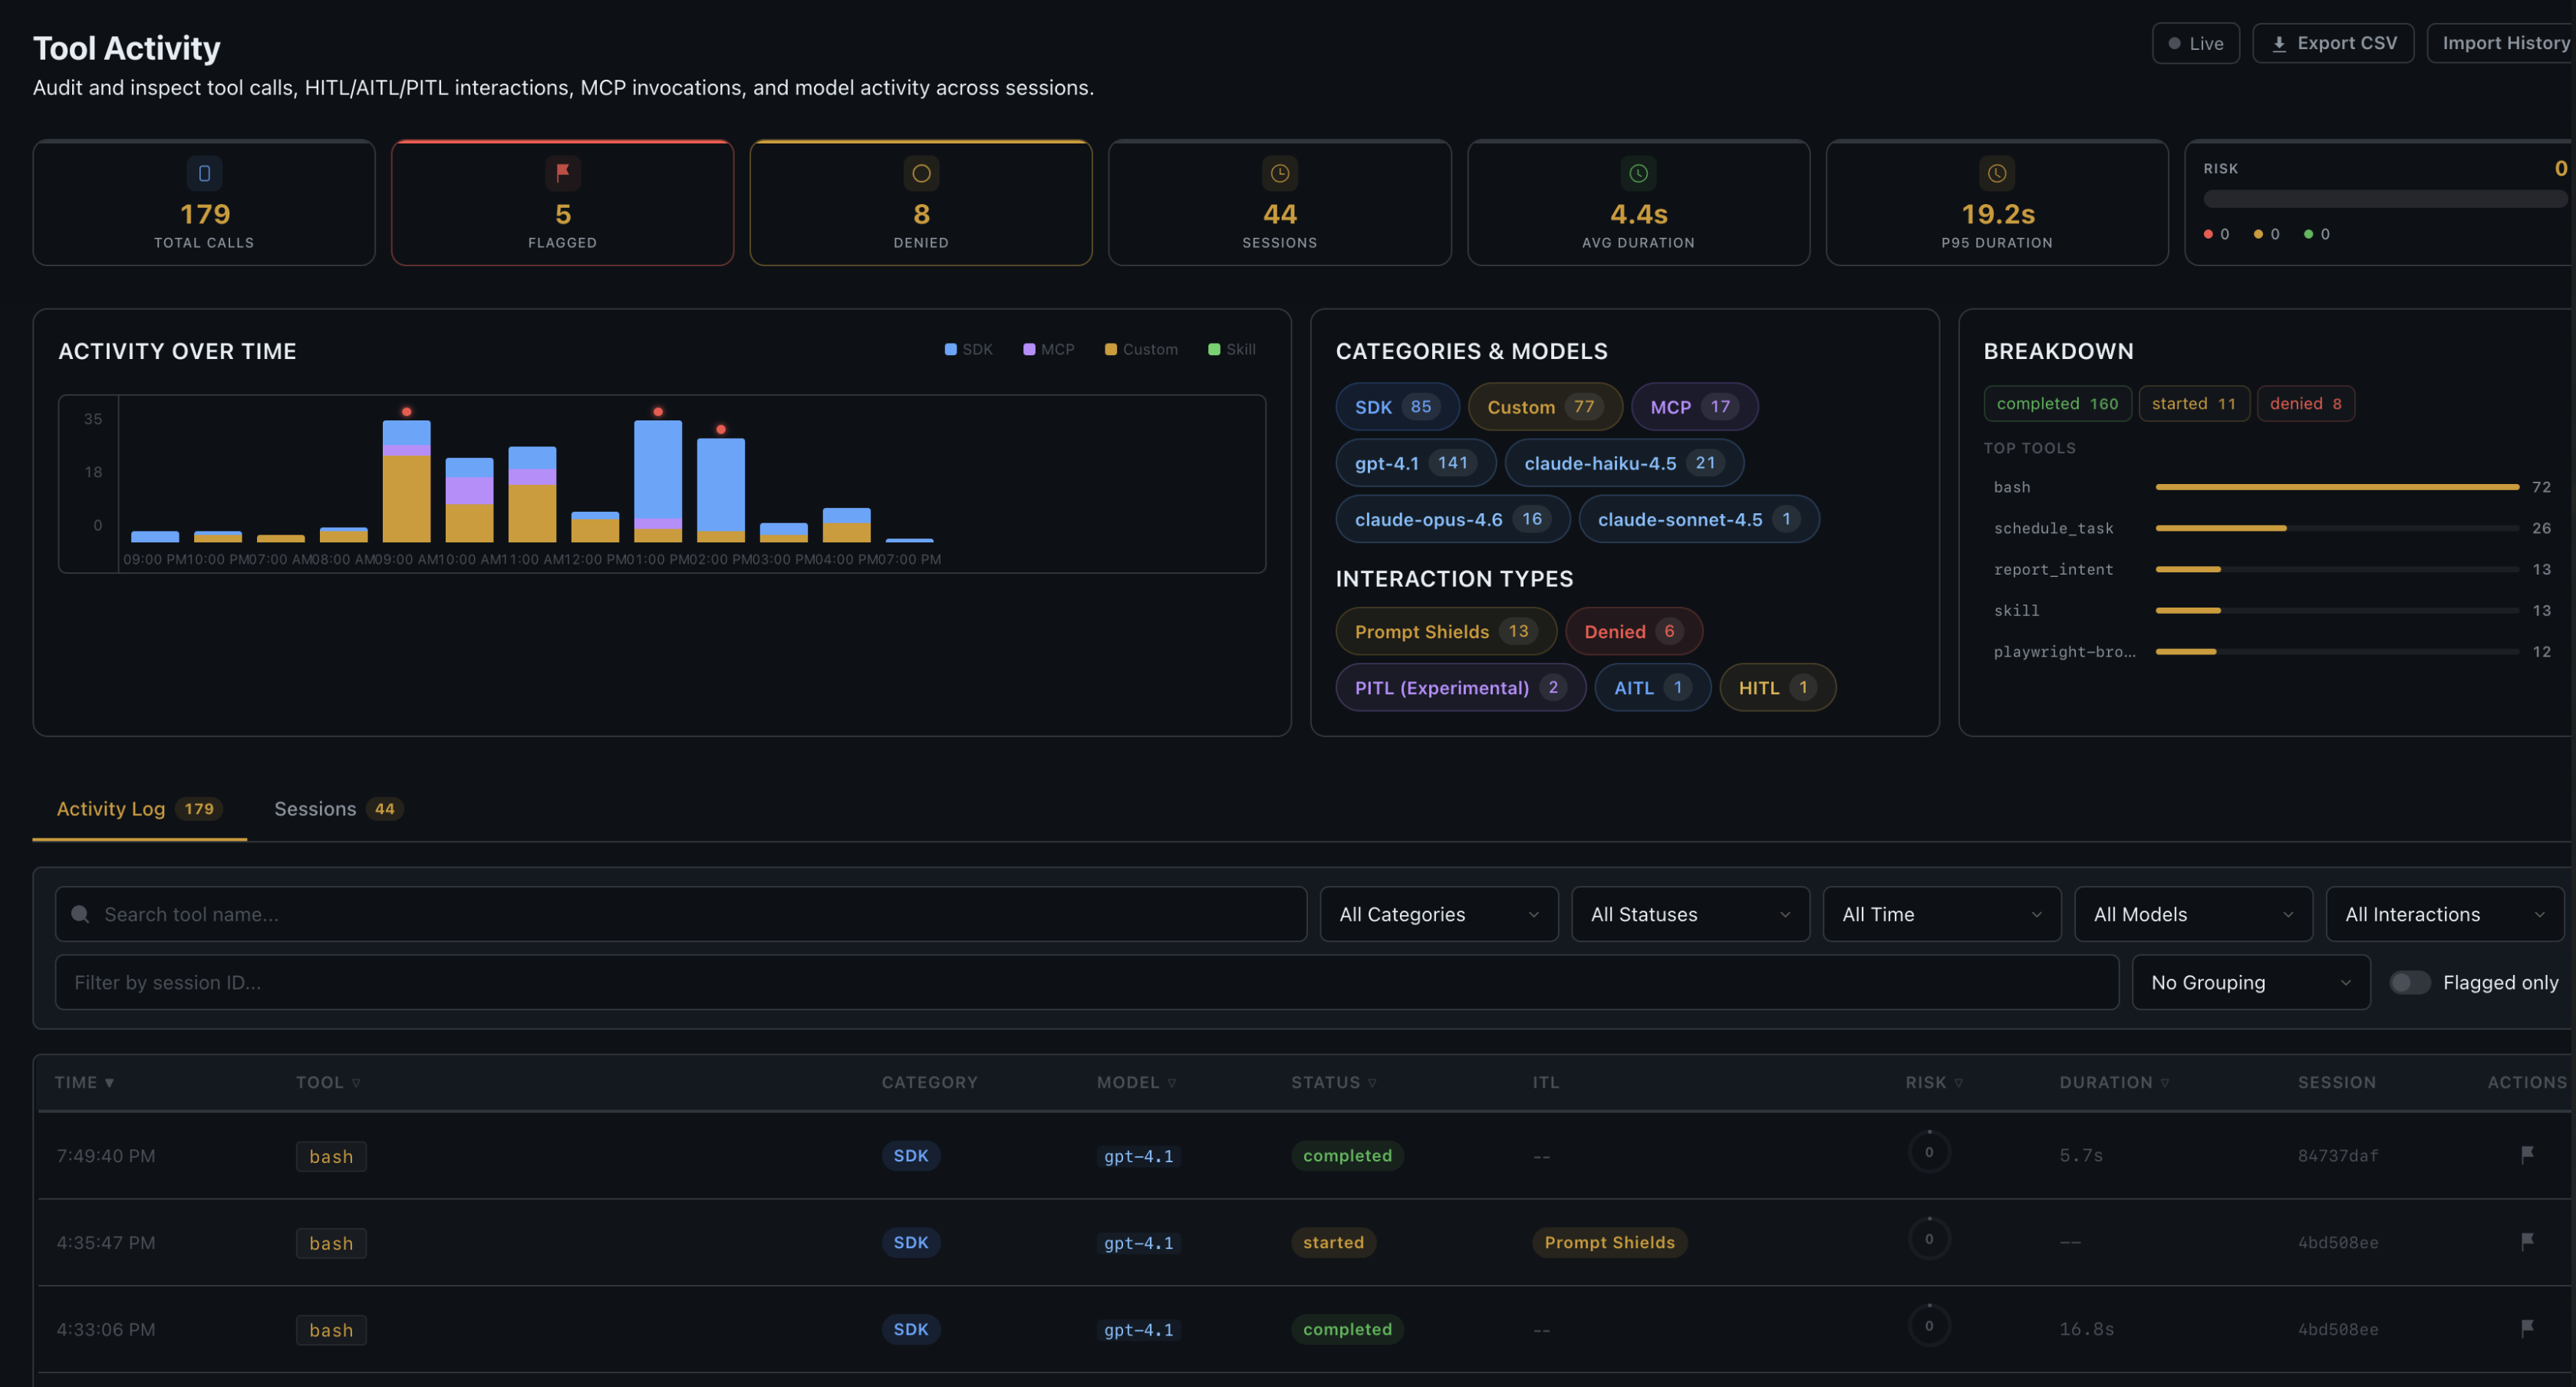
Stats Bar
Aggregated statistics at the top of the page showing total invocations, flagged entries, and breakdowns by tool, category, status, model, and interaction type.
Activity List
A filterable, searchable list of all tool invocations. Each entry shows the tool name, risk badge (color-coded by severity), status, duration, and timestamp. Clicking an entry expands it to show full arguments, result, shield analysis, and risk factors.
Session Breakdown
Per-session statistics showing tool usage patterns, risk distribution, and timeline for each chat session.
Auto-Refresh
A toggle that keeps the dashboard updating in real time as new tool calls are recorded.
Manual Flagging
Any entry can be manually flagged for review. Flagged entries are highlighted in the dashboard and included in summary statistics.
CSV Export
The full activity log can be exported as a CSV file for offline analysis or compliance reporting.
Data Storage
Tool activity is persisted as a JSONL file (tool_activity.jsonl) in the data directory. The file is append-only – entries are never modified or deleted after creation. This ensures a tamper-evident audit trail.
API
| Endpoint | Method | Description |
|---|---|---|
/api/tool-activity | GET | Query entries with filters (tool, status, category, model, interaction_type, session, flagged) |
/api/tool-activity/summary | GET | Aggregated statistics |
/api/tool-activity/timeline | GET | Time-bucketed activity data |
/api/tool-activity/sessions | GET | Per-session breakdown |
/api/tool-activity/export | GET | CSV export |
/api/tool-activity/{id} | GET | Get a single entry by ID |
/api/tool-activity/{id}/flag | POST | Flag an entry |
/api/tool-activity/{id}/unflag | POST | Unflag an entry |
/api/tool-activity/import | POST | Backfill activity log from existing session history |
Integration with Guardrails
Tool Activity and Guardrails are complementary systems:
- Guardrails enforce policy at the point of tool invocation (before execution)
- Tool Activity records what happened (during and after execution)
Every denied tool call, HITL/AITL/PITL interaction, and Prompt Shield result is automatically recorded in the activity log with the corresponding interaction_type and shield_result fields.